


In our previous article , we discussed the steps of data analysis and the tools that can be used for them. As we suggested at the end of our article, the data analysis that follows the data analysis phase is worth examining not only from a technological but also from an organizational perspective.
There are probably very few people who have not read/heard about becoming data-driven and its benefits in the recent past. In this regard, many have already encountered office software that supports this (Tableau, Power BI, Dataiku, Spotfire, etc.). Although there are companies where these tools have already been introduced, the tool for analysis still remains Excel.
The main reason for this is that at the level where the data/results should be interpreted, there is no opportunity to use these tools or there is no time to learn about them.
There are basically several ways to implement business analytics in an organization. These are the most obvious solutions:
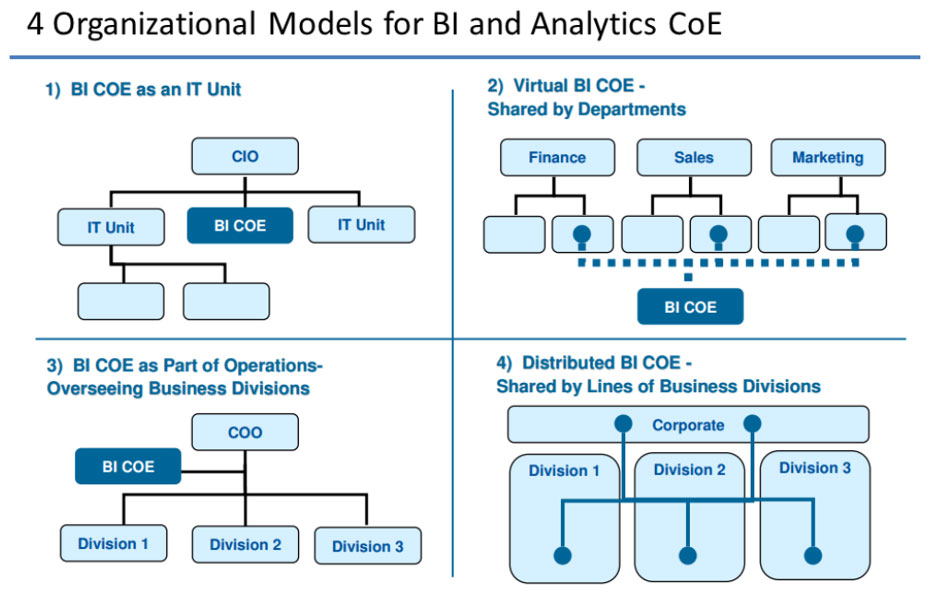
Each has its advantages and disadvantages, but if we make the wrong choice during implementation, we place unnecessary burdens on our employees and, instead of enabling business value creation, we generate even more frustration in reporting processes.
Of course, not all business users are able/willing to use data analytics tools to improve the organization’s analytical skills or support the process of becoming data-driven – nor is it necessary. A data-driven organization doesn’t mean everyone is an analyst. It means basing decisions on useful information and connections extracted from data.
Regardless, in every team we find at least one enthusiastic person who would like to participate in analytics projects. Models 2 and 4 work with them. The difference is that, similar to matrix organizations, they also belong to another BI/analytics team outside their own group (model 2). These two organizational structures allow someone to be directly between the data to be analyzed and the users of the analyses, who only deals with the given area and has an inside view of the tasks to be solved. The danger of this is that they have to do other work as well, so analytics projects may take a back seat. Also (in case 4, of course, but it can easily happen in case 2 as well) there is no regular knowledge sharing between the analysts, so each of them is a one-man army, making it much more difficult to access new knowledge and/or professional support.
Models 1 and 3 have in common that a separate team deals with analytics, and they receive requests from the business side. The difference between them is who they belong to organizationally. The danger in this case is that since they are not connected to the everyday problems of the business – they only encounter the task when they are asked to analyze something – they must first understand the business logic. This first step requires a high degree of attention and discipline from all participants. The business side’s task is to formulate the needs as precisely as possible. The analysts’ task is to choose the most suitable one for the requester from the pool of analytical solutions – and, if possible, to cover those needs that do not even arise from the business side because they are not aware of the possibilities. It is not an easy task and in almost all cases continuous redesign is necessary. They are on the right track with their joint work if (within reasonable limits, of course) as they get closer to the goal, the business side finds more and more areas to exploit, which they can then explore in new projects, and together they can create business value from this.
Companies therefore have several options available to them to properly implement the toolset typical of a data-driven organization, but in order to consciously choose one of these paths, special business attention must be paid to the process.
In addition to organizational issues, technology is of course also a determining factor in becoming data-driven. In the next, and final, part of our article series, we will deal with choosing the right BI tool.