


In our previous article, we discussed the benefits of BI tools, and in this article, we will talk a little about the types and steps of analysis - and how the various tools currently available help us with them.
In an office environment, the goal of data analysis is to support data-based decision-making. However, it is not enough to analyze our data, we need to be able to present the results to decision-makers. Preferably in an easy-to-understand, transparent form, summarizing our findings. In the case of ad-hoc analysis, it is also worth giving a broad overview of the steps of the analysis, so that it becomes clear what data we drew the conclusions from and how. Trust is a very important building block when introducing new tools and methods .
When searching for business data analytics, we couldn't find a better summary than the one provided by Deloitte:
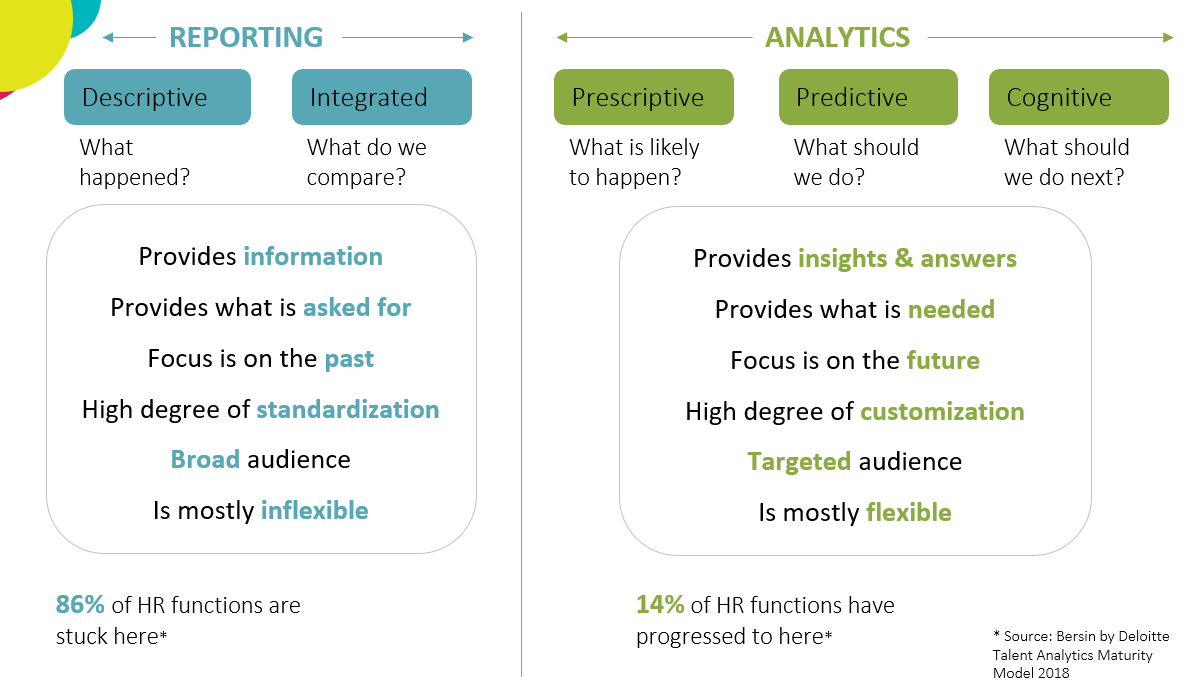
The diagram does not show a development process. Reporting is necessary in every organization. We need to constantly monitor what has happened and put it into context. We can base our future decisions on this monitoring activity, so we can infer what will happen in the future based on past events. However, to determine possible outcomes, we need prescriptive and predictive analytics. BI tools provide us with this opportunity.
All analysis begins with data preparation . Whether it's connecting data sources or transforming or cleaning data, these steps can be performed on the data preparation interface/product of the tools. Or we can even call on an independent tool to help. One example is Dataiku , which allows users to create the necessary data quality using the drag&drop method - without basic programming knowledge - or by changing the database structure.
We have slightly less room for maneuver than this, but in most cases the Power BI data preparation interface and Tableau Prep (as a separate data preparation product of the Tableau family) contain perfectly sufficient functions for business data analysis.
However, we often encounter the misconception that tables are created on the visualization interface of BI tools, which business users download and analyze further using Excel. This probably happens because the requesters are not familiar with the capabilities of BI tools. Often, they just need someone to prepare the data so that they can analyze it further and extract information from it.
If your organizational structure (more on this in the next post) requires an analytics team to execute the reports requested by the business, it is worth clarifying at the beginning of the process what exactly your users need. If they insist on doing the analysis (or even data discovery) themselves, it is worth providing the data in a secure environment and introducing them to the analytics tools, because there are huge benefits to be gained from doing so . This is a great way to make your business data-driven.
The first and most important step in data analysis is proper data preparation, which is now supported by many easy-to-use BI tools. After data preparation, analysis can follow. However, this phase should be examined not only from a technological but also from an organizational perspective, because having a star destroyer is useless if there is no proper corporate structure behind it. Details will be available soon in our third article.